You know that sinking feeling when your React app "works" but just feels… slow? Maybe scrolling is janky, inputs lag, or renders feel sticky. You've optimized useMemo here and useCallback there, but users still complain: "The dashboard feels sluggish."
The reality is, React performance issues are often sneaky. They don't show up as errors in the console or obvious code smells. To fix them, you need the right tools and the right approach.
Let's walk through the debugging techniques that actually make a difference, with real-world examples.
1. React DevTools: Your First Line of Defense
If you're not using React DevTools, you're debugging blind. This browser extension lets you inspect component trees, hooks, and props in real time.
Spotting Unnecessary Renders
Here's a common red flag: a component re-renders even when its props haven't changed.
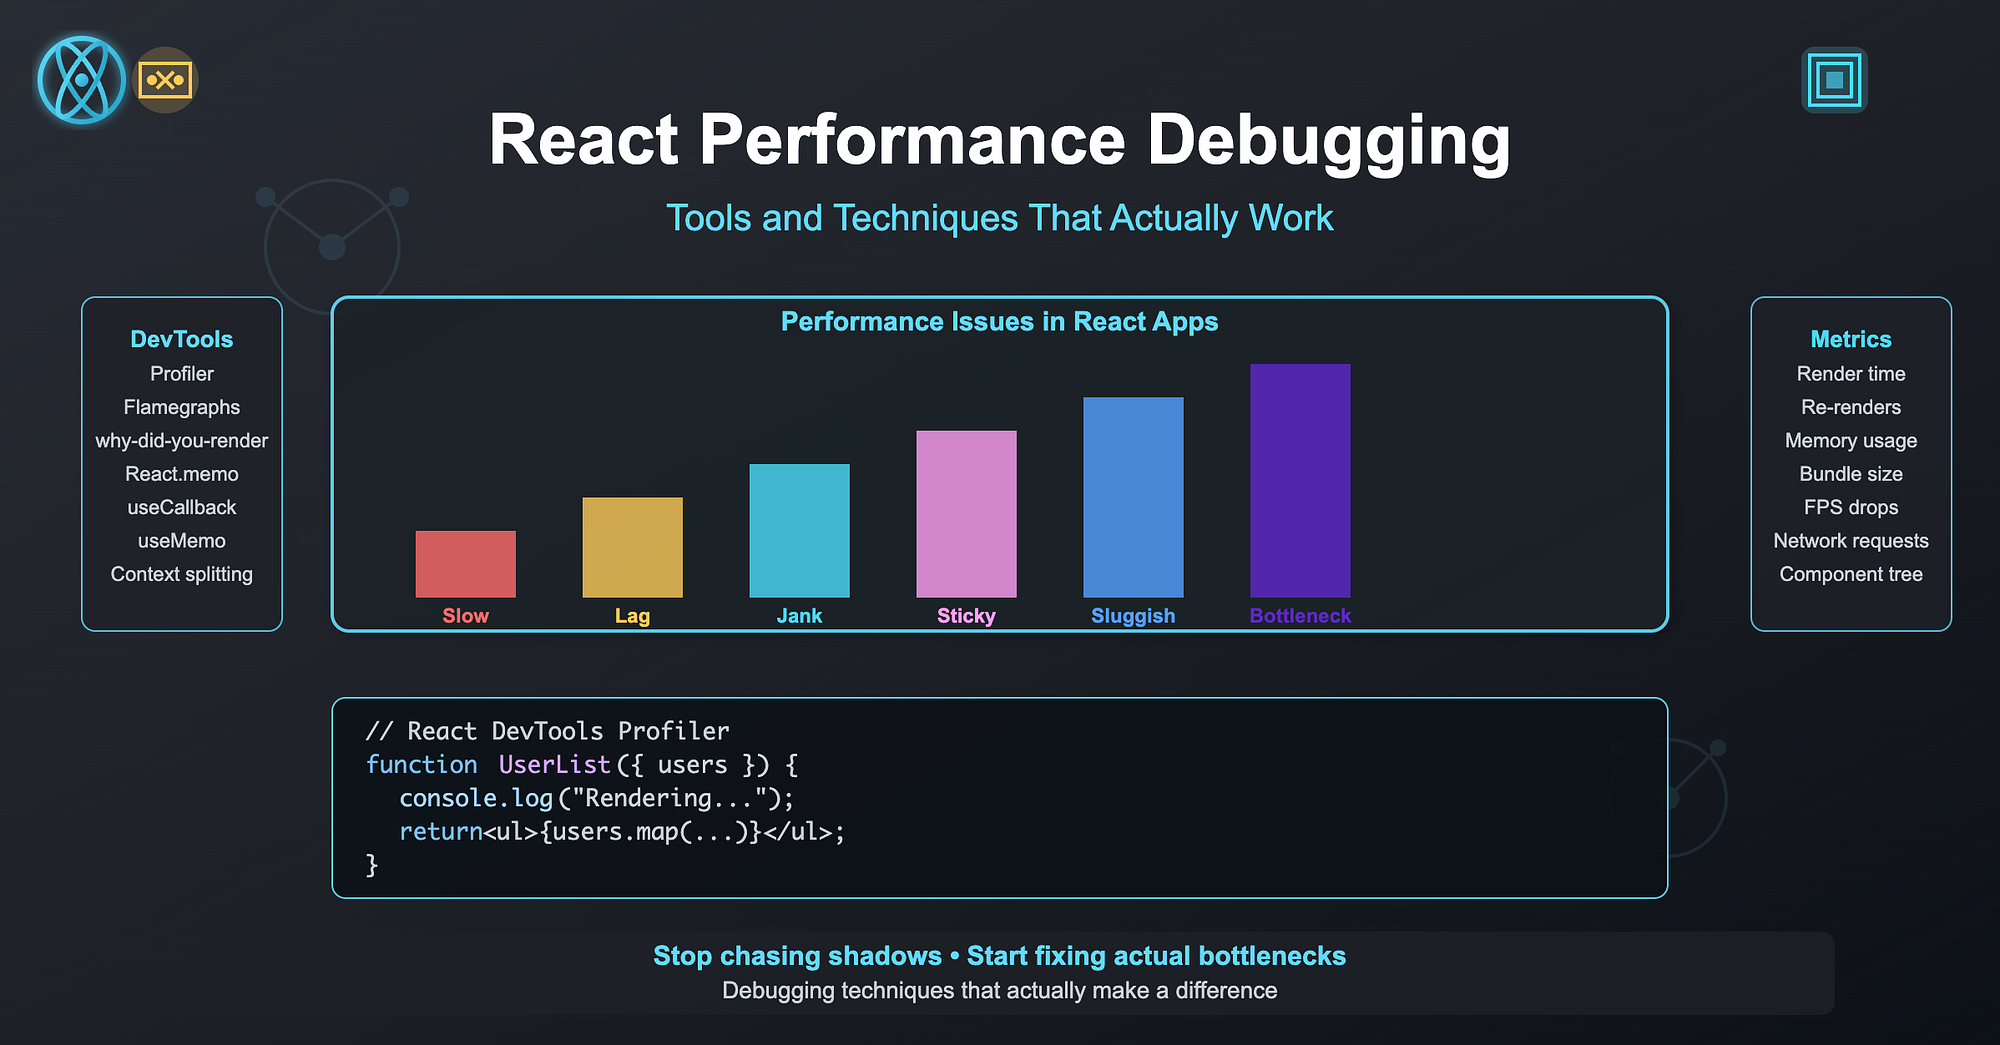
function UserList({ users }) {
  console.log("Rendering UserList..."); // Debug log
  return (
    <ul>
      {users.map((u) => (
        <li key={u.id}>{u.name}</li>
      ))}
    </ul>
  );
}
Open DevTools → Highlight updates when components render. Now interact with your app. If UserList keeps flashing when nothing changed, you've got wasted renders.
Quick Fix
Wrap it in React.memo:
const UserList = React.memo(function UserList({ users }) {
  return (
    <ul>
      {users.map((u) => (
        <li key={u.id}>{u.name}</li>
      ))}
    </ul>
  );
});
Boom — UserList only re-renders when users actually changes.
2. The Profiler Tab: Where Time Really Goes
Ever feel like you're guessing which component is slow? The Profiler tab removes the guesswork.
Record a profiling session, click around your app, then stop recording. You'll see each render with its duration.
Example Flamegraph
Imagine this profile:
- Dashboard → 15ms
- Chart → 120ms
- Sidebar → 4ms
Clearly, Chart is your bottleneck. No more chasing ghosts.
3. Flamegraphs: Finding the Real Culprit
Flamegraphs show a visual "stack" of where React spent its time.
- Wide bars = expensive renders
- Tall stacks = deep re-renders triggered by one change
Example: You click a filter, and suddenly the whole tree re-renders. Flamegraph highlights that your AppContext.Provider update is rippling through the app.
Fix
Split contexts or use selectors:
// Instead of this
<AppContext.Provider value={{ users, theme, filters }}>
  <Dashboard />
</AppContext.Provider>

// Do this
<UsersProvider value={users}>
  <ThemeProvider value={theme}>
    <FiltersProvider value={filters}>
      <Dashboard />
    </FiltersProvider>
  </ThemeProvider>
</UsersProvider>
Result: updating filters no longer forces theme consumers to re-render.
4. useCallback and useMemo: The Double-Edged Swords
Yes, they're optimizations but if misused, they're overhead.
Bad Usage
const handleClick = useCallback(() => {
  console.log("Clicked!");
}, []); // memoized for no reason
This doesn't save performance. It just adds complexity.
Tip
Use them when passing props down to memoized children. Otherwise, skip them.
5. Production Debugging with why-did-you-render 🕵️
Sometimes, you can't tell why a component is re-rendering. Enter why-did-you-render.
Setup:
import React from "react";
if (process.env.NODE_ENV === "development") {
  const whyDidYouRender = require("@welldone-software/why-did-you-render");
  whyDidYouRender(React, { trackAllPureComponents: true });
}
Now, every unnecessary re-render gets logged in the console:
[why-did-you-render] UserList re-rendered because props.users changed shallowlyThat's your smoking gun.
6. Battle-Tested Debugging Workflow
Here's how I approach React performance bugs in production apps:
- Enable "Highlight updates" in DevTools to see wasted renders
- Record a Profiler session → Identify the slow component
- Check the Flamegraph → See what triggered re-renders
- Apply fixes: memoization, context splitting, virtualization, etc.
- Add why-did-you-render for ongoing guardrails
This workflow has saved my team countless hours of guesswork.
Wrapping Up
React performance isn't about sprinkling useMemo everywhere. It's about using the right tools to see what's really happening under the hood and only then applying the right fix for the right problem.
With DevTools, Profiler, Flamegraphs, and helper libraries, you'll stop chasing shadows and start fixing the actual bottlenecks.
Because at the end of the day, users don't care how clever your code is. They care if your app feels fast.