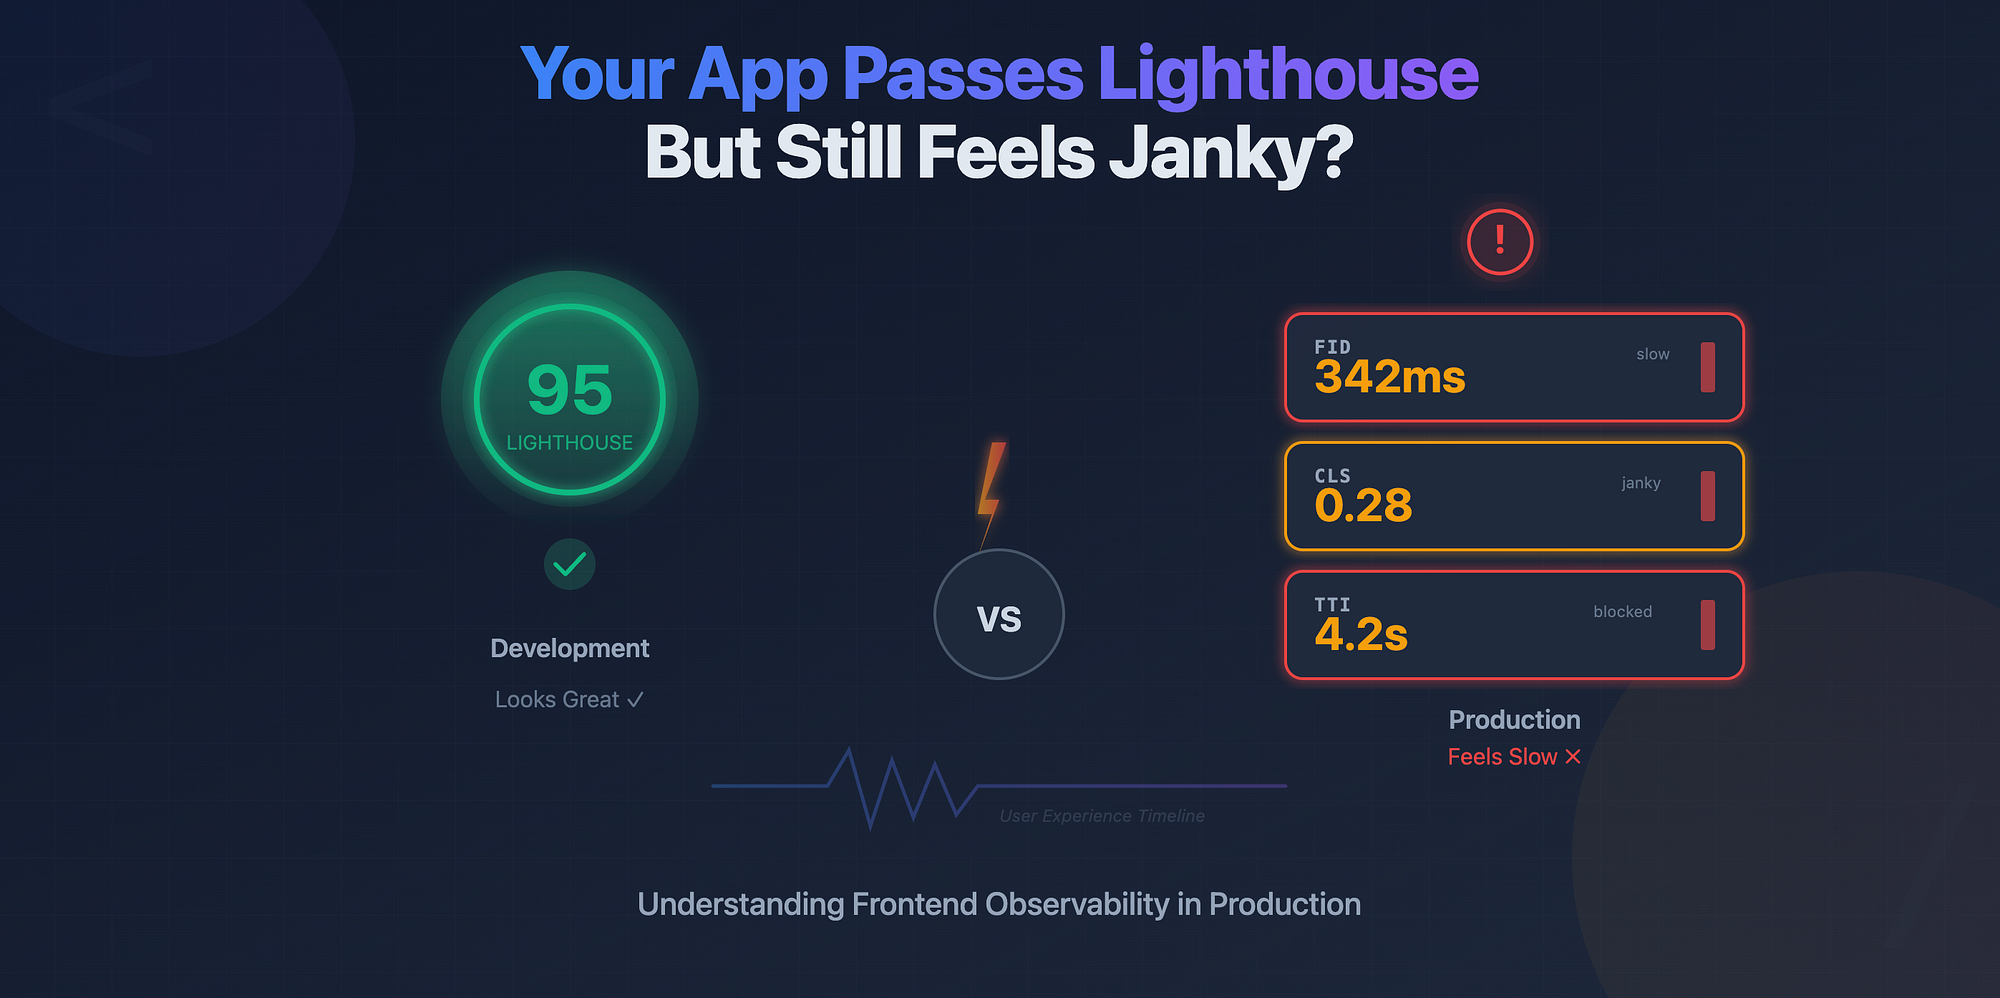
You optimize your bundle size, your Lighthouse score shows a solid 95, yet users complain that "it feels slow." That disconnect happens because what you see in development is not what your users experience in production.
Modern frontend apps are complex systems. Frameworks like React, Vue, or Next.js optimize a lot under the hood, but real-world performance depends on what actually happens in the user's browser, on their network, and on their device.
This is where frontend observability comes in. It's not just about knowing what you shipped, but how it behaves in the wild.
In this post, we'll go deep into how to measure rendering performance in production, what metrics matter, and how to instrument your React app (or any modern frontend) to get real, actionable data.
Development performance ≠ Production performance
Let's start with a simple truth:
Development mode lies.
When React runs in development, it includes additional checks, warnings, and validations. Your app is slower, and your profiler data is inflated.
In production, the opposite happens. Everything is optimized, but you lose visibility. Unless you've added instrumentation, you have no clue which components are slow or what causes layout shifts.
Frontend observability bridges this gap by bringing measurement tools into your production code safely and selectively.
Key Metrics You Should Measure
Let's cover the most important metrics that reveal how your UI feels to users.
-
FID (First Input Delay) — Measures the time between a user's first interaction (like a click) and the browser's response. High FID means the main thread is busy.
-
TTI (Time to Interactive) — How long before the page becomes fully interactive. This helps you catch slow hydration or large JS execution times.
-
CLS (Cumulative Layout Shift) — Tracks how much the layout moves unexpectedly. A high CLS means users experience janky UIs, like buttons shifting mid-click.
-
React Commit & Render Times — The React Profiler gives you insights on how long renders and commits take for each component. In production, you can log similar timings using the Performance API.
Measuring Real Render Timings
React gives us good tooling in dev mode, but we can measure similar things in production using the Performance API.
Here's a small example:
// record render start
performance.mark("App-render-start");

// render something
ReactDOM.render(<App />, document.getElementById("root"));

// record render end
performance.mark("App-render-end");
performance.measure("App-render", "App-render-start", "App-render-end");

// retrieve measurements
const measures = performance.getEntriesByName("App-render");
console.log(measures[0].duration); // render time in ms
You can wrap this around expensive components or hydration points.
For React specifically, you can use the web-vitals package to measure FID, CLS, and TTI in real time and send the data to your analytics backend.
Example: Integrating web-vitals + PerformanceObserver
Here's a simple setup:
import { getCLS, getFID, getTTFB, getLCP } from "web-vitals";

function sendToAnalytics(metric) {
  fetch("/analytics", {
    method: "POST",
    body: JSON.stringify(metric),
  });
}
getCLS(sendToAnalytics);
getFID(sendToAnalytics);
getLCP(sendToAnalytics);
getTTFB(sendToAnalytics);
This captures real metrics from real users and sends them to your monitoring backend (you can also use tools like Datadog RUM, Sentry Performance, or New Relic).
You can extend this further by using PerformanceObserver to track custom marks:
const observer = new PerformanceObserver((list) => {
  for (const entry of list.getEntries()) {
    console.log(entry.name, entry.duration);
  }
});

observer.observe({ entryTypes: ["measure"] });
With this, you can log performance of specific features like modals, dashboards, or route transitions.
A Simple Observability Checklist
Here's a practical checklist to make your frontend measurable and maintain performance visibility:
- Add Web Vitals tracking (FID, CLS, LCP, TTFB, TTI).
- Instrument critical interactions (route changes, modal opens, heavy components).
- Collect render timings using Performance API.
- Integrate metrics with analytics or monitoring backend.
- Set thresholds and alerts for degraded performance.
- Correlate slow performance with user environment (device, network).
Why It Matters
Without production observability, you are blind to how your app behaves in real conditions. Metrics from development or synthetic benchmarks rarely capture actual user experience.
By instrumenting rendering performance, you can:
- Catch regressions before users complain.
- Identify slow components in real user sessions.
- Make informed trade-offs in architecture decisions.
Frontend observability is not just about dashboards, it's about accountability for user experience.
Wrapping Up
- Development mode is not representative of real performance.
- FID, CLS, TTI, and render timings are the most valuable frontend metrics.
- Use Web Vitals and Performance APIs to measure in production.
- Observability enables continuous performance improvement, not guesswork.
Understanding what happens in production separates a good frontend engineer from a great one. The next time your app "feels slow," you'll know exactly where to look.